Allasso – trading analytics platform
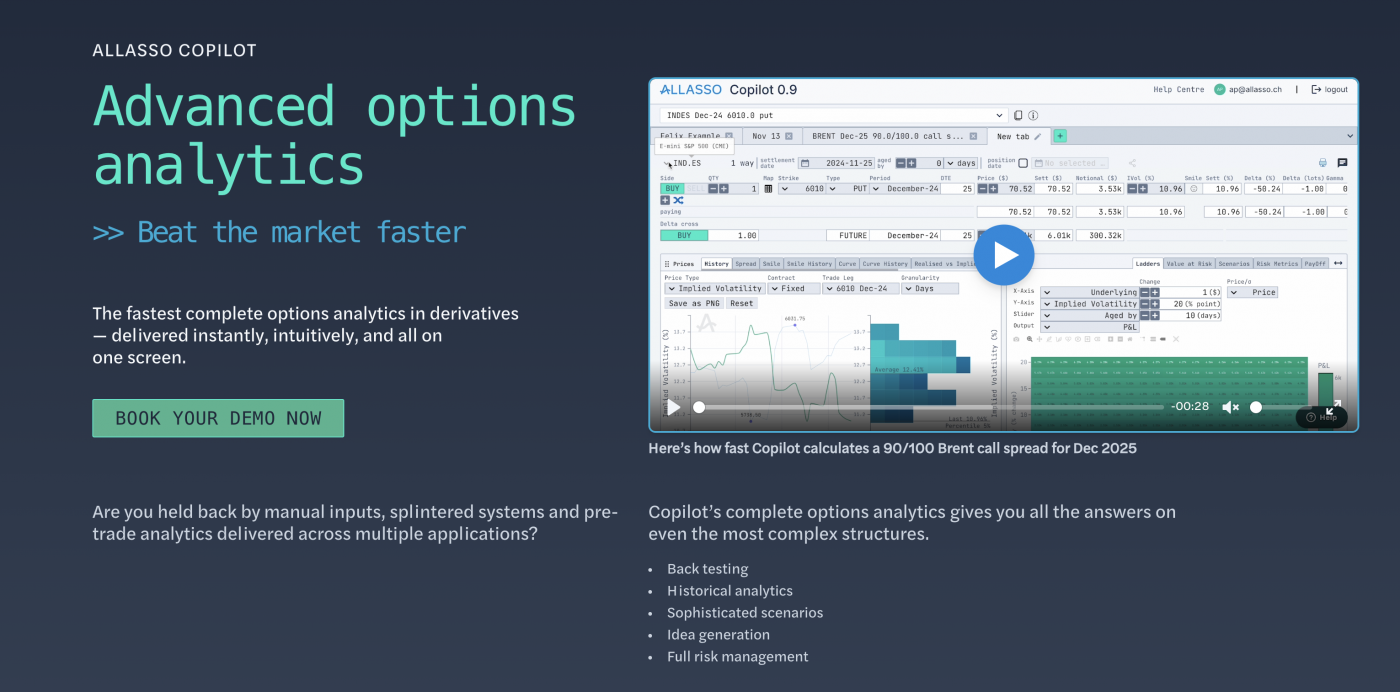
Allasso is a trading analytics platform for financial professionals who need to understand how market instruments behave historically, in current conditions, and under hypothetical scenarios. We built the product from its first interactive workspace through to a modular analytics ecosystem covering instruments, quotes, volatility surfaces, and shared trading structures.
CHALLENGE
Trading professionals work with instruments that are difficult to reason about in isolation. Price, implied volatility, and underlying market inputs interact in non-obvious ways, and most tools either show static snapshots or require heavy manual setup to compare scenarios. The challenge was to build a workspace that made scenario exploration fast and intuitive, and then to scale that experience as the product grew from single-instrument analysis into a multi-module platform.
SOLUTION
The platform was initiated as a focused workspace: select an instrument, adjust its parameters, and immediately see how it behaves. Users could shift price, implied volatility, and other inputs to explore future scenarios or replay historical behavior. As the product matured, we added a richer analytics layer – multiple charts, calculated outputs, risk views, and historical analysis running side by side.
Static page generation introduced a new workflow: predefined trading structures could be shared with external or non-logged-in users, giving clients access to prepared analysis without needing to configure anything themselves. Workflow improvements followed pausing recalculations while editing multiple positions, batch recalculation, and PDF export, each one reducing friction in how professionals interact with trading data.
The charting layer evolved technically in step with the product’s ambitions. An initial Plotly implementation gave way to D3, giving the team precise control over custom trading visualizations and tighter integration with calculated outputs.
Two new modules extended the platform beyond single-instrument work. The Quotes module lets users load many instruments at once, compare them in tables and charts, edit quote structures, and recalculate across multiple positions together. The Volatility module gives users direct control over volatility surfaces and smiles: edit values visually, publish or reuse calculated structures, and feed those changes back into live trading calculations.