Monitoring applications in several Kubernetes clusters with Prometheus, Grafana and Loki
Monitoring and logging are important parts of application development and support. This statement relates not only to the production environment but to staging and others as well. What would be a solution to have all the metrics and logs from different environments or clusters in a single place?
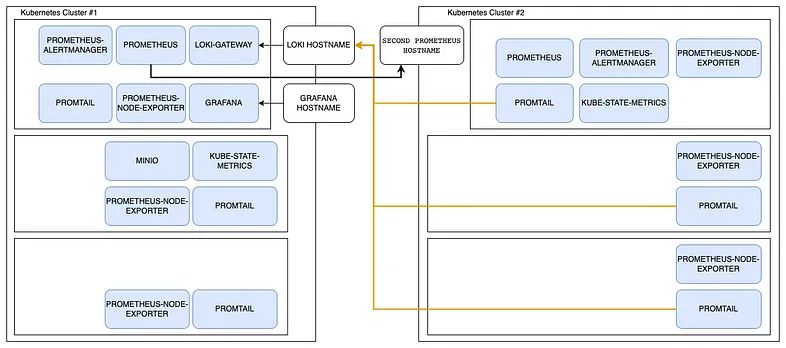
Let’s assume that you have 2 separate K8S clusters for our environments. We don’t want the additional load in our main cluster, but still want to get the required metrics and logs from there.
The solution below will keep all the parts that can create any additional load in one cluster[Cluster #1 in the diagram] and have only the required tools in the main cluster[Cluster #2]. Please note that all the blue parts are in the monitoring namespace.
A couple of words before we start — we use the Prometheus stack for monitoring. Prometheus is a standard de facto in K8S world. It’s going to store all the metrics we get from the applications. Grafana will help us with making all these metrics and logs visible. Loki is an open-source software for logging. We also use some other tools like MinIO, Promtail, etc.
Install MinIO
MinIO is an Object Storage solution compatible with AWS S3 API, which would allow us to store our logs and other data directly in our cluster.
First of all, we have to create our monitoring namespace:
kubectl create namespace monitoringNow we can install MinIO with a Helm chart:
helm repo add bitnami https://charts.bitnami.com/bitnami
helm repo update
helm install minio bitnami/minio --set="persistence.size=20Gi" -n monitoring
An important note — make a rough analysis of how many logs and metrics your application will generate and want to store simultaneously. The example above create a persistence volume with 20Gb space.
Install Loki
Loki is our solution for logging aggregation that we are going to use. We are going to connect it to MinIO so our logs would be hosted in MinIO.
To install Loki we are using its Helm chart:
helm repo add grafana https://grafana.github.io/helm-charts
helm repo update
helm upgrade --install loki grafana/loki-distributed -n monitoring -f .\loki-values.yaml
But this time to adjust more parameters instead of a simple — set key, we are using a .\loki-values.yaml file:
loki:storageConfig:aws:
s3: null
s3forcepathstyle: true
bucketnames: loki
endpoint: http://minio:9000
region: null
access_key_id: {ACCESS_KEY_ID_FROM_MINIO}
secret_access_key: {SECRET_ACCESS_KEY_FROM_MINIO}
insecure: trueboltdb_shipper:
shared_store: s3
active_index_directory: /var/loki/index
cache_location: /var/loki/cache
cache_ttl: 168hfilesystem: {}schemaConfig:configs:
- from: 2020-09-07
store: boltdb-shipper
object_store: aws
schema: v11
index:
prefix: loki_index_
period: 24hgateway:ingress:
enabled: true
ingressClassName: nginx
hosts:
- host: {LOKI_HOSTNAME}
paths:
- path: /
pathType: ImplementationSpecific
tls:
- secretName: logs-tls
hosts:
- {LOKI_HOSTNAME}basicAuth:
enabled: true
username: {LOKI_USER}
password: {LOKI_PASSWORD}
Install Promtail
Promatil is one of several log agents supported by Loki, it is the default one, so we are going to use it.
The installation again would be done with Helm chart:
helm repo add grafana https://grafana.github.io/helm-charts
helm repo update
helm upgrade --install promtail grafana/promtail -n monitoring -f .\promtail-values.yaml
And as in previous example with Loki, we are gonna use a values file:
config:
clients:
- url: https://{LOKI_HOSTNAME}/loki/api/v1/push
basic_auth:
username: {LOKI_USER}
password: {LOKI_PASS}
Install Prometheus
Prometheus is an alerting and monitoring solution that allows us to collect and store metrics on our resources.
And it would be installed with a Helm chart:
helm repo add prometheus-community https://prometheus-community.github.io/helm-charts
helm repo update
helm upgrade --install prometheus prometheus-community/kube-prometheus-stack -n monitoring -f .\prometheus-values.yaml
And this is the values file we are using to configure Persistent Storage, Alert Manager Ingress, and disable default Grafana as we are going to use a standalone one.
prometheus:
prometheusSpec:storageSpec:
volumeClaimTemplate:
spec:
storageClassName: do-block-storage
accessModes: ["ReadWriteOnce"]
resources:
requests:
storage: 10Gialertmanager:
ingress:
enabled: true
ingressClassName: nginx
hosts:
- {ALERTING_HOST}
paths:
- /
pathType: ImplementationSpecific
tls:
- secretName: alerts-tls
hosts:
- {ALERTING_HOST}grafana:
enabled: false
Install Grafana
Grafana allows you to query, visualize, alert on and understand your metrics no matter where they are stored. Create, explore, and share beautiful dashboards with your team.
And in order to install it, we are using a Helm chart:
helm repo add prometheus-community https://prometheus-community.github.io/helm-charts
helm repo update
helm upgrade --install grafana grafana/grafana -n monitoring -f .\grafana-values.yaml
To provide the configurations we need, we are using this values file. You might notice that we pass OIDC configuration to Grafana to enable login with the Google authentication method. It’s the auth.google part of the config.
datasources:
datasources.yaml:
apiVersion: 1
datasources:
- name: Loki
type: loki
url: http://loki-loki-distributed-query-frontend.monitoring:3100
- name: Prometheus
type: prometheus
url: http://prometheus-kube-prometheus-prometheus.monitoring:9090ingress:
enabled: true
ingressClassName: nginx
hosts:
- {GRAFANA_HOSTNAME}
paths:
- /
pathType: ImplementationSpecific
tls:
- secretName: monitoring-tls
hosts:
- {GRAFANA_HOSTNAME}grafana.ini:
server:
root_url: https://{GRAFANA_HOSTNAME}
auth.google:
enabled: true
client_id: {CLIENT_ID}
client_secret: {CLIENT_SECRET}
scopes: https://www.googleapis.com/auth/userinfo.profilehttps://www.googleapis.com/auth/userinfo.email
auth_url: https://accounts.google.com/o/oauth2/auth
token_url: https://accounts.google.com/o/oauth2/token
allowed_domains: {DOMAIN_FOR_OAUTH}
allow_sign_up: truepersistence:
enabled: true
Add another cluster to the monitoring
To add another cluster to the monitoring all we have to do is to install the agents on this cluster and expose endpoints to allow communications:
- Create a monitoring namespace in the second K8S cluster
- Install Promtail as described previously
- Install Prometheus as described previously
- Expose the second cluster Prometheus with an Ingress
- Set first cluster Prometheus to federate scrape exposed endpoint
To set Prometheus to federate mode we have to upgrade it by adding additional scrape configs to the values file:
additionalScrapeConfigs:
- job_name: 'federate'
scrape_interval: 15shonor_labels: true
metrics_path: '/federate'params:
'match[]':
- '{__name__=~".+"}'static_configs:
- targets:
- {SECOND_PROMETHEUS_HOSTNAME}
Next steps
Once you’ve got all the parts installed and configured, your next step will be Grafana dashboard configuration to ease your usage experience.